
One of the biggest challenges for an SEO always revolves around value, whether it’s how to show a client the value of the work done or how to extract valuable insights from our data. In today’s post, we’re going to look at how to get a little better at the second point.
Google Search Console allows us to easily download the list of URLs that bring the most clicks to our page. Now, what do we do with this data? As we have been seeing for a few months now, at puntorojo we like to extract as many insights as possible from our data. An insight is any information that allows us to make a decision.
Let’s start!
- Map the site to be analyzed: This time we are going to use a mix of tools to be able to see which theme is central to the blogs from Ahrefs, Semrush, and Moz. To achieve this, we have to start mapping the blogs with some crawler (in this example we are going to use ScreamingFrog).
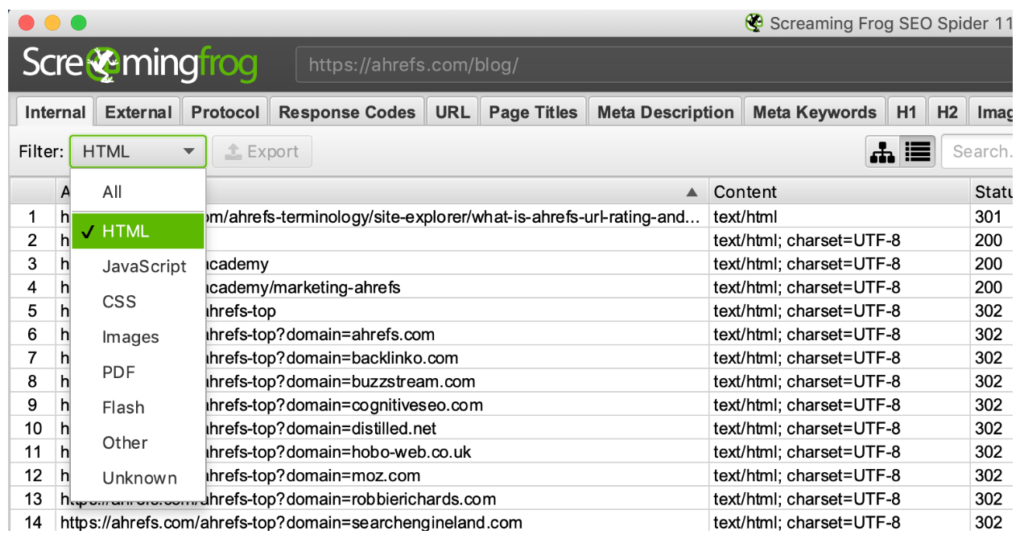
- Filter by URL type: Once we have the list of URLs, we are going to filter everything that is a page to make sure that no other type of content is lifted (e.g. image URLs).
- Filter by subdirectory: The next step is to filter the URLs to show only those that are from the blog. A simple way to do this is with the top right filter.
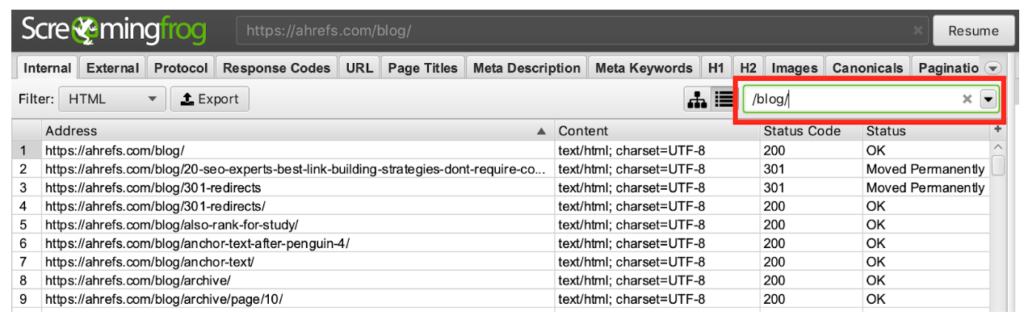 Advanced tip: you can filter by regular expressions and not only text strings.
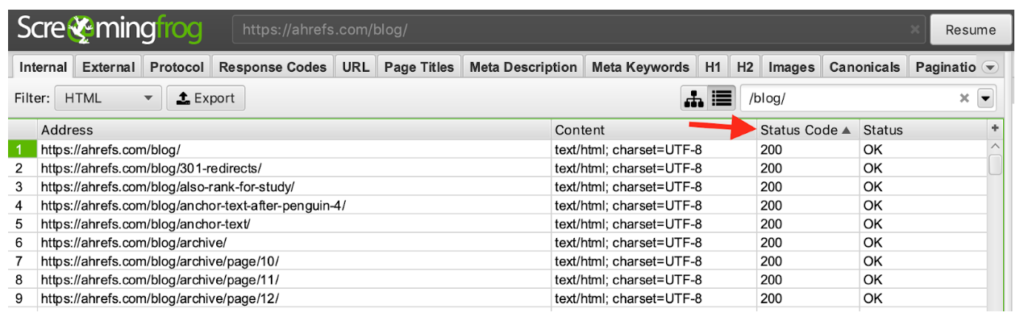
 - Pull up URLs that return 200: Now we are going to sort the results by response code. Since we are going to work with URL slugs, we don’t want to pollute our analysis with old URLs.
For example, there is a slug that changed from “how-to-build-links-with-guest-articles” to “guest-blogging”. This indicates an optimization due to a strategy (or change of strategy) since they went from focusing on the keyword guest articles to the keyword guest blogging. As we are interested in the current strategy, we are not going to look at the discarded URL but at the final URL after the redirect.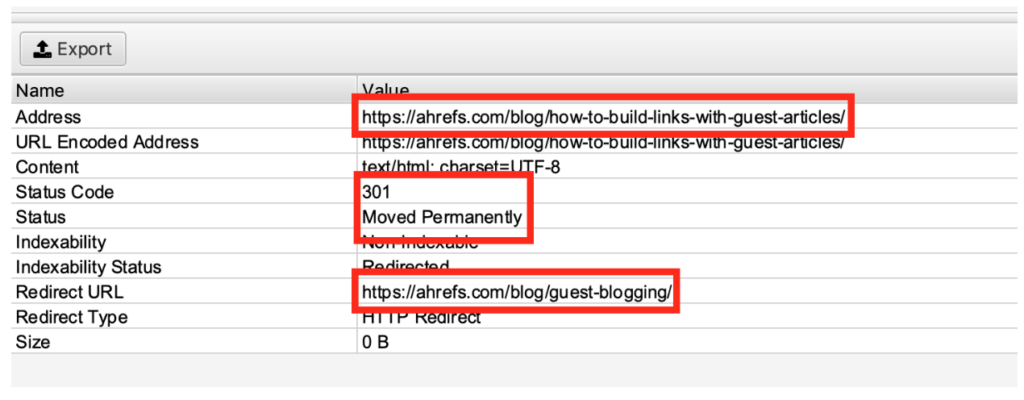
- Save the URLs: In Google Sheets we are going to dump all URLs that return 200.
- Filter by URLs that redirect: Since we also want to know the URLs that were modified, inside the Response Codes tab, we filter by the blog pages that redirect.
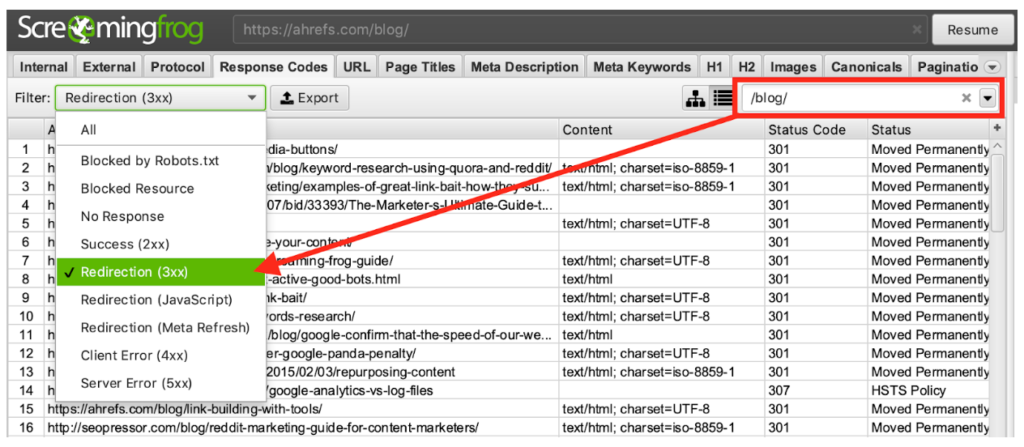
- Save the redirection URLs: As in step 5, we are going to save the URLs that interest us in the same Google Sheets, but now we are going to look at the Redirect URL column since this is the one that indicates the page that is displayed after the redirection is executed.
- Remove repeated URLs: Once in Google Sheets, we will remove the URLs that are repeated using the late functionality of Remove duplicates in the Data menu.
9. Remove irrelevant URLs: There are likely to be URLs that we don’t want in the listing such as blog home, paginations, author URLs, posts in other languages, and URLs that redirect and now point to external sites, etc. Clean these URLs manually or via a Sheets function if you find a repeating pattern.
Note: In this case, we are going to remove category URLs since we are interested in building our categorization and not necessarily sticking to the one selected by the blog creators. For example, the category “technical SEO” is too broad and we will want to segment it as “page speed, machine learning, IT, etc.).
10. Repeat with other benchmarks: Once our list is ready, we are going to do the same with all our competitors. In the Sheets spreadsheet, we are going to add a column that shows the name of the site we are benchmarking so we can then plot it in different series.
11. Write categorization UDF: To automatically categorize the information we extracted, we are going to use the Google Sheets script editor to create a UDF (user-defined function).
12. Select categorization keywords: To get the most out of each slug, we have to put together different lists (technically arrays) with keywords that determine without grayscale the content of a slug. Once the arrays are completed, run a loop through each of them checking if each word appears in the URLs being analyzed. If it appears, the name of the category is written in a cell.
Example script here:
categorize function (slug) {
  //Write an array for each category and fill it with keywords
var keywords_tutorials = [
    "tutorial", "how-to", "guide", "step-by-step",
  ];

  var keywords_links = [
    "link", "anchor",
  ];

  var keywords_content = [
    "content", "text", "copywriting", "post", "blog",
  ];

  var keywords_technical = [
    "core", "rankbrain", "penguin", "panda", "hummingbird", "diversity", "unnamed", "medic",
    "maccabees", "fred", "possum", "mobilegeddon", "pigeon", "everflux", "pagerank", "page-rank",
    "sandbox", "penalty", "penalties", "google-bot", "googlebot", "mobile", "phone", "301", "200",
    "404", "403", "503", "302", "tag", "robots", "html", "javascript", "php", "keyword", "key-phrase",
    "domain", "directory", "htaccess", "redirect", "tool",
  ];


  var output = "";

  //Each array must have a loop that returns the category name
  for (i=0; i <= keywords_tutoriales.length-1; i++)
  {if (slug.toLowerCase().indexOf(keywords_tutorials[i]) >= 0){output += "tutorials" + ", ";}}

  for (i=0; i <= keywords_links.length-1; i++)
  {if (slug.toLowerCase().indexOf(keywords_links[i]) >= 0){output += "links" + ", ";}}

  for (i=0; i<= keywords_content.length-1;i++)
  {if (slug.toLowerCase().indexOf(keywords_content[i]) >= 0){output += "content" +", ";}}

  for (i=0; i<= keywords_tecnicas.length-1;i++)
  {if (slug.toLowerCase().indexOf(keywords_technical[i]) >= 0){output += "technical" + ", ";}}

  //If it does not find a category, it categorizes it as 'other'.
  if (!output){
    output = "other";
    } else {
      //remove final ', '
      output = output.substring(0,output.length - 2);
      output = output.split(", ");

      //eliminate duplicates
      var output_unique = [];
      for (o=0; o <= output.length-1;o++){
        if(output_unique.indexOf(output[o]) == -1) {
          output_unique.push(output[o]);
        }
      }
      //sort the array alphabetically
      output = output_unique.sort();
      output = output.toString();
    }
  return output;
}
13. Writing the function: Now that we have everything categorized we have to write the function in the spreadsheet and see the output.
Pro Tips:
– Don’t copy/paste for your entire list of slugs because if you do a lot the Google server running our script may block your requests for a couple of minutes since running this function has a cost for Google.
– You should copy and paste about 500 rows, wait a few seconds and run 500 more rows… until you finish all your URLs.
– Be sure to copy and paste the result of the script as a value so that the function does not run again each time you load the spreadsheet.
– Do not copy and paste as a value until you have finished running the function on all the rows.
14. Sort outputs: Next step, we will separate the data into columns since it is likely that some entries have more than one category.
Note: In this example, we hide the column with the slugs to make it easier to work with the data.
15. List the benchmarked sites: Using the UNIQUE function, we list all the competing sites we are considering for the report.
16. Count total values per site: In order to automate the spreadsheet a bit, let’s count how many entries were contemplated for each site using the following formula:
=COUNTIF(A:A,G2)
17. Count unique values: Making use of the total number (and considering that the first row is the header), we put together the following formula to count how many times each term appears for each competing site:
=COUNTIF($C2:$F211,”=”&I$1)
Note: Don’t forget to adjust the range contemplated in the count for each client’s rows since rows 2 to 211 correspond only to Ahrefs.
18. Drawing percentages: We are almost there! But if we take into account that Ahrefs has 210 blog posts, we can’t really compare it with SEMrush which has 7 times more (and Moz even more). So let’s update our formula to show the percentage of the total instead of the total amount of each category. The formula would now look like this:
=COUNTIF($C2:$F211,”=”&I$1)/$H2
Note: Be sure to update only column I and then drag I2, I3 and I4 to M2, M3 and M4, respectively.
19. Format as a percentage: To do things neatly, let’s convert all the values in I2:M4 to percentages by selecting the range of cells and then clicking the percentage format button.
Note: Keep in mind that the percentages can add up to more than 100% since a note can have more than one subject (for example, contents and tutorials).
20. Set the data: To simplify things, we copy all the percentages and paste them as a value. Next, we delete the totals column (column H, in our case).
21. Graphing: The moment of truth has arrived! We select our entire dashboard and then generate the graph.
Final result
In conclusion, we draw the following insights…
- SEMrush has the most number of tutorials
- Ahrefs is the one that talks the most about links (obviously)
- SEMrush is the blog most oriented to content generation
- SEMrush is the blog with the most technical content
- Moz is the blog with the most varied topics among the three.
Note: If we want more insights, we should add more categories and filters inside our script to reduce the number of blog posts that fall into others.
Well, this was a bit longer tutorial, but we didn’t want to stop sharing it with you. We hope you can find SEO value in categorizing URLs (either your own or those of your competitors). As always, if you have any questions, leave us a comment below.
Until next time and good rankings!