Data Analytics it’s the science of analyzing raw data and extracting from it patterns and insights that add value to decision making. By raw data, we mean unparsed, unprocessed, and unformatted information.
Many algorithms sift through the information for you and return a complete report with insights into what was analyzed. To put it bluntly, Data Science is the use of technology to analyze data. In this post, we are going to see how you can start extracting data from your keywords using Python.
Before we start, let’s define some terms:
- Data: The information collected
- Analytics: The data analysis
- Insights: What you learn after analyzing the data
In order to bring some added value to the organic SEO industry, I’m going to stay away from Google Analytics and similar tools in this post as there are thousands of posts written about the topic by people more qualified than me.
We are going to use the following tools:
- Google Analytics (I know I said I won’t use it, but we are going to extract the data from here in this example)
- Google Chrome Console
- Notepad (or equivalent)
- Python
How to extract search term data from Google Analytics
- Open Google Analytics in Google Chrome
- In Google Analytics, go to Acquisition > Search Console > Queries
- Filter view to show 5000 rows
- Open Google Chrome inspector > “Elements” tab
- Navigate to one of the rows that display Google Search Console information to make sure it is in the inspector cache. If this step is not done correctly, keywords may not appear when running the script.
- Go to the “console” tab
- Ctrl + L to clean the console
- Paste the following script and press ENTER*.
for(var kwds=document.getElementsByClassName(“_GApu”),clicks=document.getElementsByClassName(“_GAtjb”),total=kwds.length,content='<table align=”center”><tr><th>Keywords</th><th>Clicks</th><th>Impresiones</th><th>CTR</th><th>Ranking</th></tr>’,i=0;i<total;i++){var current_kwd=kwds[i].innerHTML,current_clicks=clicks[i].innerText.split(“(“)[0].replace(“%”,””).replace(“.”,””).replace(“,”,”.”).trim(),current_impresiones=clicks[i+1].innerText.split(“(“)[0].replace(“%”,””).replace(“.”,””).replace(“,”,”.”).trim(),current_ctr=clicks[i+2].innerText.split(“(“)[0].replace(“%”,””).replace(“.”,””).replace(“,”,”.”).trim(),current_posicion_media=clicks[i+3].innerText.split(“(“)[0].replace(“%”,””).replace(“.”,””).replace(“,”,”.”).trim();i+=3;var row=”<td>”+current_kwd+'</td><td align=”center”>’+current_clicks+'</td><td align=”center”>’+current_impresiones+'</td><td align=”center”>’+current_ctr+'</td><td align=”center”>’+current_posicion_media+”</td>”;content+=”<tr style=\”font-family: ‘Open Sans’\”>”+row+”</tr>”}with(output='<html><head><title>Punto Rojo Tools – Google Analytics Keyword Extractor</title><link rel=”stylesheet” type=”text/css” href=”https://fonts.googleapis.com/css?family=Open+Sans” /><link rel=”stylesheet” type=”text/css” href=”//fonts.googleapis.com/css?family=Open+Sans” /></head><body>’,output='<table align=”center” width=”50%”><tr><td align=”left”><img src=”https://puntorojo.com/blog/wp-content/themes/punto_rojo/img/logo_mini.png” width=”200px”></td><td align=”right”><h1 style=”font-family: \’Open Sans\'”>Google Analytics Keyword Extractor</h1></td></tr></table><br><br>’,output+=content,output+=”</body></html>”,window.open())document.write(output),document.close(); - If you want to see directly the information without formatting to export it to a CSV, paste the following code:
for(var kwds=document.getElementsByClassName(“_GApu”),clicks=document.getElementsByClassName(“_GAtjb”),total=kwds.length,content=”Keywords;Clicks;Impresiones;CTR;Ranking<br>”,i=0;i<total;i++){var current_kwd=kwds[i].innerHTML,current_clicks=clicks[i].innerText.split(“(“)[0].replace(“%”,””).replace(“.”,””).replace(“,”,”.”).trim(),current_impresiones=clicks[i+1].innerText.split(“(“)[0].replace(“%”,””).replace(“.”,””).replace(“,”,”.”).trim(),current_ctr=clicks[i+2].innerText.split(“(“)[0].replace(“%”,””).replace(“.”,””).replace(“,”,”.”).trim(),current_posicion_media=clicks[i+3].innerText.split(“(“)[0].replace(“%”,””).replace(“.”,””).replace(“,”,”.”).trim();i+=3;var row=current_kwd+”;”+current_clicks+”;”+current_impresiones+”;”+current_ctr+”;”+current_posicion_media+”<br>”;content+=row}var output=”<html>”;with(output+=content,output+=”</html>”,window.open())document.write(output),document.close(); - Copy keywords, paste them into Notepad
- Add ‘Keywords’ to the first row of the txt (without quotation marks and with capital K)
- Save as ‘keywords.csv’
- If you want to save the script for future reference, follow the steps below:
- In the Google Chrome inspector, go to the ‘Sources’ tab.
- In the menu on the left, click on the ‘Snippets’ tab (if it does not appear, click on the little arrow on the right).
- Click on ‘+ New Snippet’.
- Name the script ‘Google Analytics – Keyword Extractor’ or similar.
- Paste the code in the window next to it
- Ctrl + S to save (or its MAC equivalent)
- That’s it! Each time you want to run it, double click on the snippet name in the left window of Sources > Snippets
How to manipulate data with Python
- Install Python3
- Install modules:
- pandas
- matplotlib
Now we are going to see how to load data from a CSV in Python and how to manipulate it. For practicality, the code to read the CSV will be shown only once, but it must always be in the script.
Load the data with the following snippet:
import pandas as pd
import matplotlib.pyplot as plt
data = pd.read_csv(‘keywords.csv’, delimiter = ‘;’, encoding = ‘ISO-8859-1’)
Show the first 10 rows of the CSV:
print(data.head(10))
Count the number of rows:
print(len(data)
Count the number of rows 2:
print(«number of rows: %i» % len(data))
#The %i indicates that an integer variable goes there.
#When closing double quotes, the % indicates what should replace %i
How to do data splicing:
print(data[:10]) #displays the first 10 rows
print(data[5:]) #displays all but the first 5 rows
print(data[-3:]) #displays the last 3 rows
print(data[:-2]) #displays all but the last 2 rows
print(data[-5:-2]) #sample from the 5th from the end to 2nd from the end
Change all keywords to lowercase:
data = data[‘Keyword’].str.lower()
#Translated, it would be: the keywords are now the keywords but in lower case.
How to get the average CTR per number of words
As a demonstration, let’s take a look at some of what can be done to get SEO insights with Python.
Using the code above we are going to:
- Load pandas and matplotlib.pyplot modules
- Load the dataset with the search terms and dump them into a variable called “data”.
The data is now in what is called a Pandas DataFrame. Pandas is a Python module that allows you to manipulate data as if it were a spreadsheet, except that it does not render the content until you ask it to. This saves system resources: imagine loading millions of rows, clicking on a cell, rendering millions of rows again, and so on… it is not practical and that is why we use Pandas.
Pandas works with columns and rows, just like Excel or Google Sheets. In these examples, our DataFrame is going to be called “data”.
How to see the columns of a DataFrame in Pandas:
print(data.columns)
How to see the content of a column in Pandas:
print(data[‘CTR’]) #the column is called CTR
How to average the values of a column in Pandas:
print(data[‘CTR’].mean())
How to obtain the average of a column in Pandas grouped according to another column:
average = data.groupby([‘Ranking’])[‘CTR’].mean()
print(average)
The output should be similar to this (varies depending on the data)

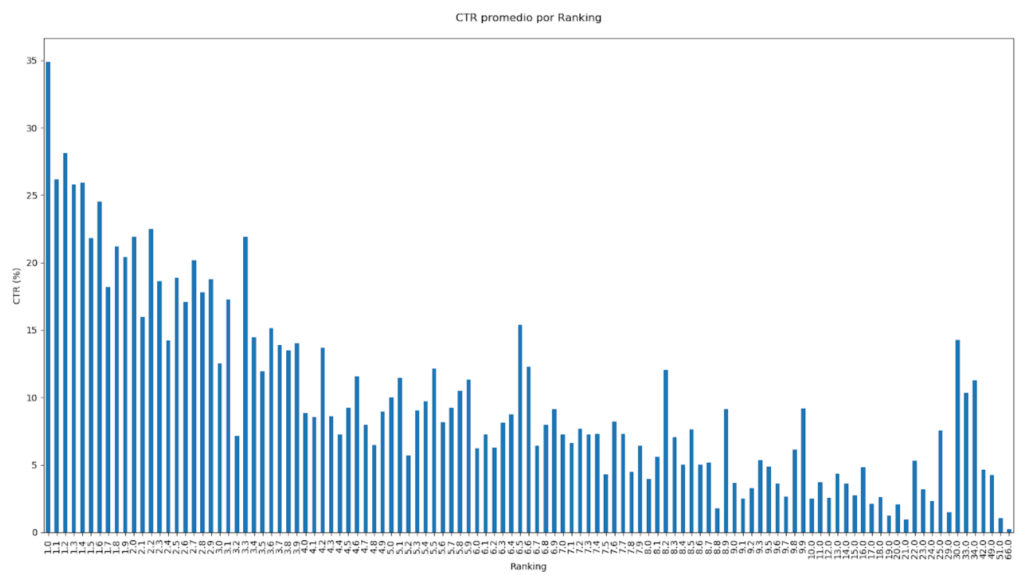
How to plot the average of a column in Pandas with Matplotlib:
#continued from previous script
average.plot(kind=’bar’)
plt.title(‘Average CTR per ranking’)
plt.xlabel(‘Ranking’)
plt.ylabel(‘CTR’)
plt.show()
The output should look like this (varies according to data)

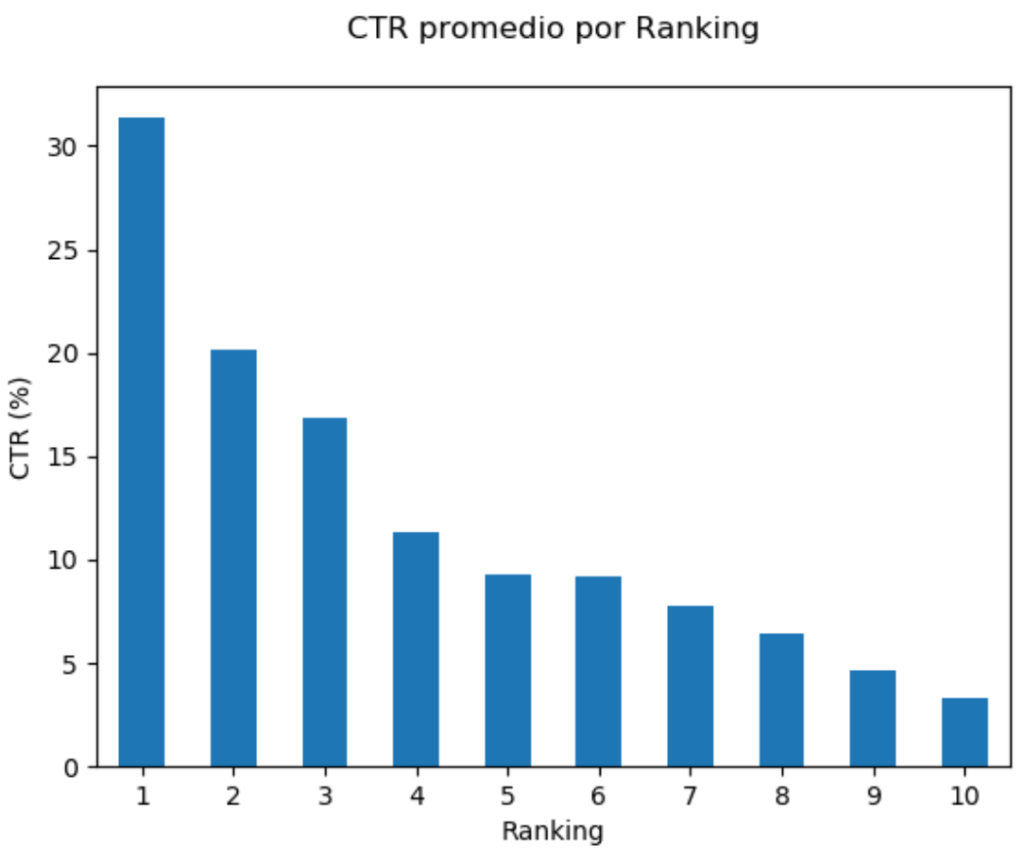
To plot only the positions from 1 to 10, it is necessary to reduce the DataFrame before drawing the averages.
df = df[df[‘Ranking’] <= 10]
average = df.groupby([‘Ranking’])[‘CTR’].mean()#.plot(kind=’bar’)#, cmap=’coolwarm’)
If we want to round the rankings and change the type of data displayed in the column so that they do not show decimals (rounding would treat, for example, a rank 1.9 as a rank 2):
df = df[df[‘Ranking’] <= 10]
df[‘Ranking’] = df[‘Ranking’].round().astype(int)
average = df.groupby([‘Ranking’])[‘CTR’].mean()

And if we plot that by adding the plotting lines shown above and adding these two lines to show the X-axis numbers horizontally and without decimals:
plt.xticks(rotation=’horizontal’)

And that’s it! We got to start getting into all that is Data Science for SEO. There are a lot of graphs that can be born from this data and even more after starting to generate data from the data with feature engineering. An example could be to look at positioning according to the number of words in a search term, some short, medium, and long-tail keywords, etc.
What programming language do you use to extract graphs and insights from your data? Let us know below so we can shape future posts. Until next time and good rankings!


