
As we mentioned in our last post, it’s usually hard to show the value of an SEO campaign to a client or potential client. By not being able to see the value of the optimization work or not being able to visualize the return on investment, a client may cancel a campaign or decide not to hire your SEO services.
In today’s article, we are going to see another way of communicating the impact that an SEO optimization campaign can have. The outcome will be shown to the client as the money that the campaign can generate.
Let’s get started!
Data we need:
Google Search Console Performance Information
- Google Keyword Planner average monthly search volumes (optional)
- Google Analytics conversion rate
- Google Analytics average ticket
Let’s suppose we are trying to close an SEO campaign for a site that sells beer online. Let’s work a little bit with the data we have…
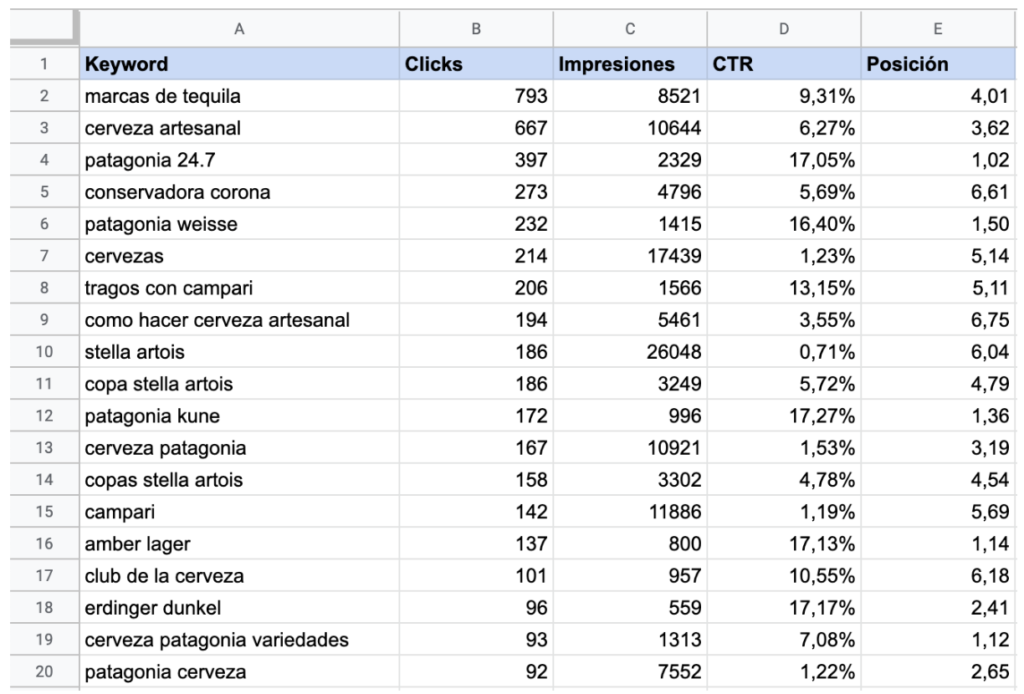
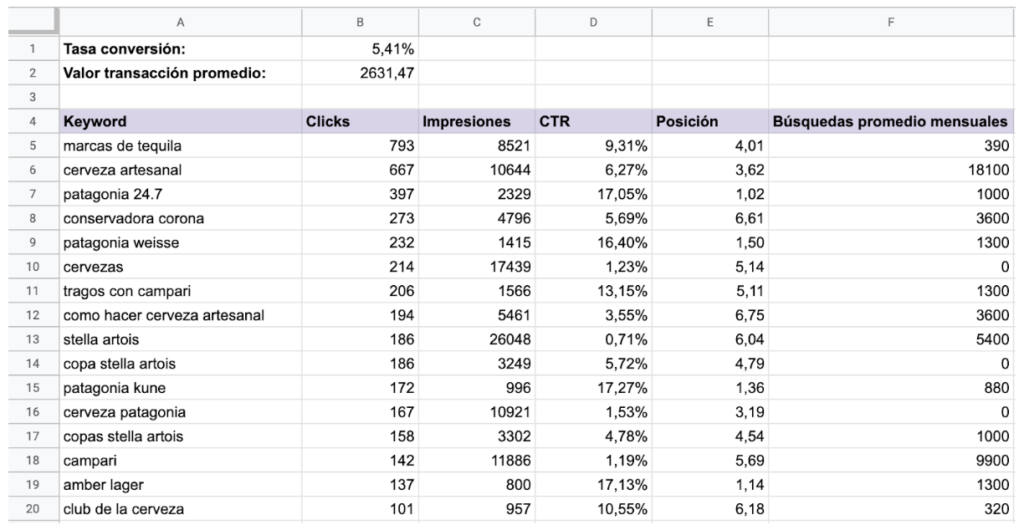
First of all, we are going to collect the keywords that bring traffic to the site. To do this we are going to use the Google Search Console performance report. We must see the number of total clicks, total impressions, average CTR, and average position.
Let’s dump this information to a Google Sheets
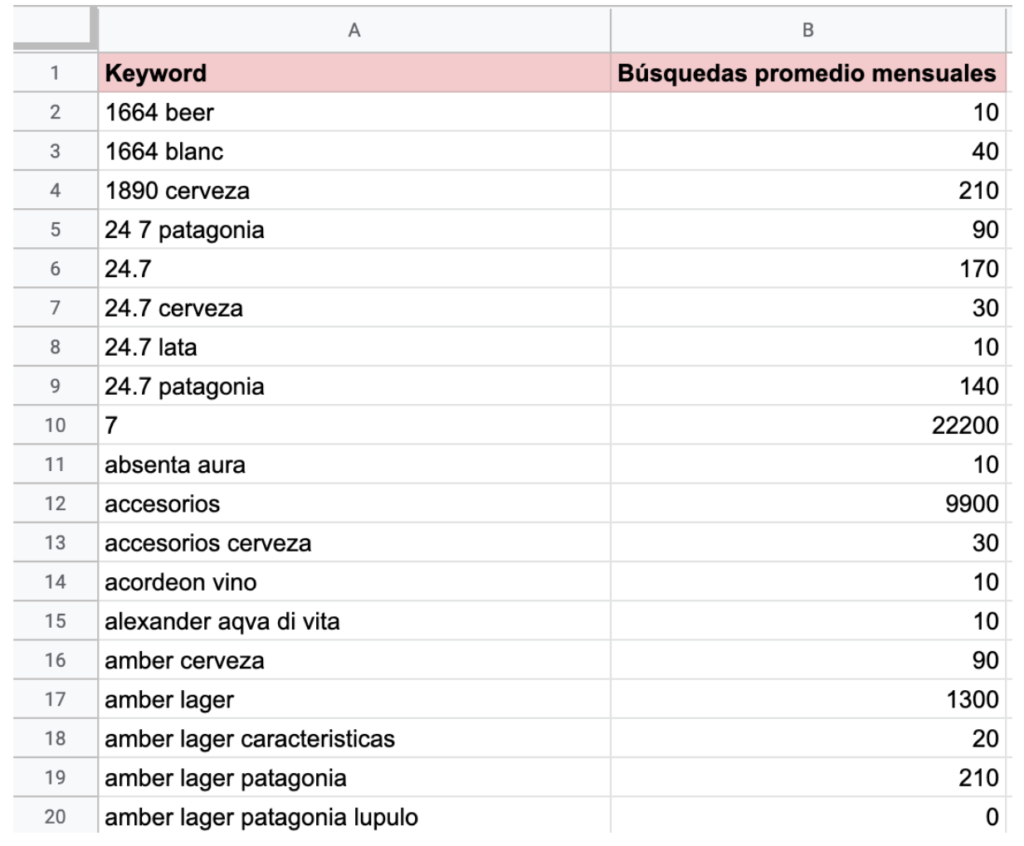
Let’s collect the average monthly search volumes for these Google Keyword Planner keywords. We are going to add this information into a new tab within the same Google Sheet.
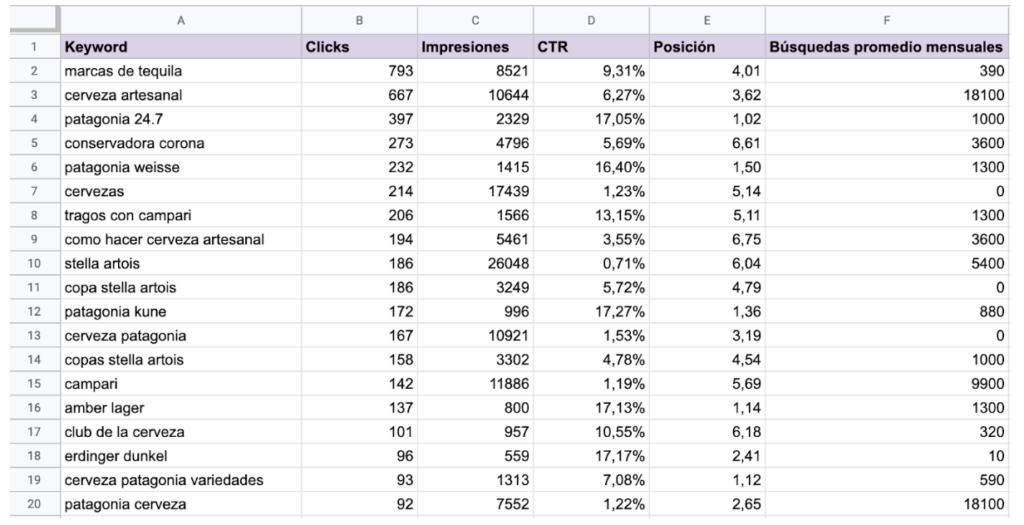
Next, we are going to unify both tables using the function VLOOKUP.
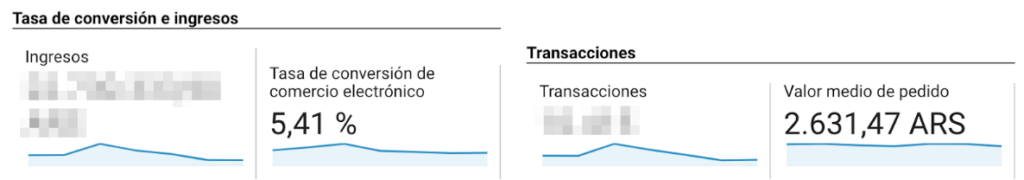
Once it’s done, we are going to go to Google Analytics, inside the conversions menu > e-commerce > overview
From this report we are going to extract two specific data:
- E-commerce conversion rate
- Average order value
We return to our sheet to add these variables to our data.
Feature engineering
Here comes the fun part! As we saw in the Data Science post, feature engineering consists of generating data from our data.
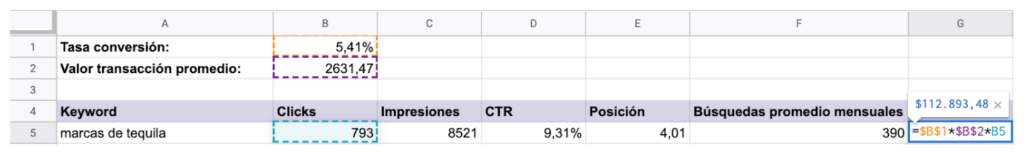
In this case, if we know how many visits a keyword brought, how many people have to enter our site for a purchase to be made, and the average value of that purchase, we can easily know how much money a keyword brought us.
With this simple formula we can obtain this data:
revenue generated per keyword = clicks x average conversion rate x average order value
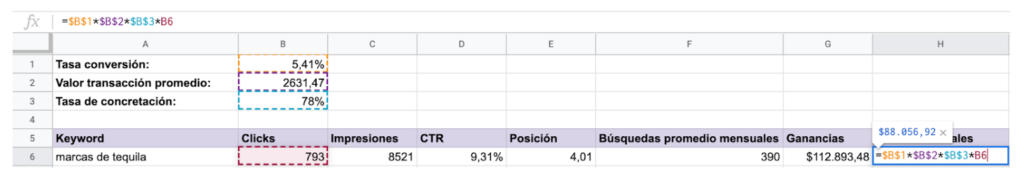
If the client has the percentage of online purchases that fall through after purchasing a product, we can add this data to our table. Let’s assume that, on average, 22% of online transactions are not completed (for whatever reason). This means that our “completion rate” would be 78%.
The formula would look like this:
revenue generated by keyword = clicks x average conversion rate x average order value x completion rate
Forecasting
Forecasting is the exercise of projecting future data with current information. In this particular case, we have several ways to perform this projection:
- calculate an organic traffic growth of x%.
- calculate a CTR growth by x%.
- calculate an improvement in organic positioning by x%.
- calculate growth in clicks by x%.
- calculate the growth of impressions by x%.
In order not to complicate things unnecessarily, let’s see how much profit we could project if we were able to increase organic traffic by 10%, 15%, and 20%. Remember that we are following the premise of using this report to demonstrate the opportunities for increased sales that a potential clients can have if they implement an SEO strategy in their strategy.
Let’s see the formula:
$B$1*$B$2*$B$3*(B6*110%)
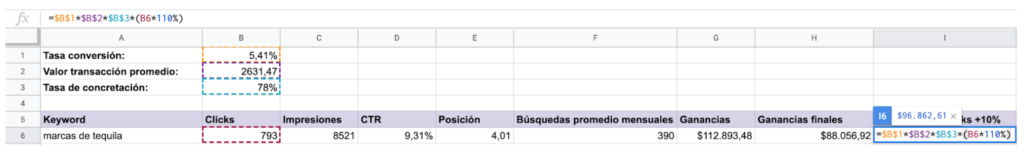
note: parentheses are for visual aid only
This step is repeated for projections of +15% and +20%.
Finally, let’s add up all the projections. This way we see the potential client’s gains if he/she continues without SEO vs. with SEO implemented in three different measures.

If you are thinking that the difference between not implementing an SEO optimization campaign and doing one is not that shocking, keep in mind that this analysis is only for those keywords that are bringing in traffic. After doing exhaustive keyword research and content gap analysis to see all the search terms that are being wasted, the number of projected gains grows considerably.
If you want to contemplate the growth for keywords that are not currently being considered, we have to take into account the column of average monthly searches, among others, to predict the number of clicks.
Final considerations
When we get too deep into the world of optimization, it’s easy to lose sight of the ultimate goal of all our efforts. It’s common to hear analysts consider that the fruit of all their labor is to improve organic traffic or rankings, but in reality, that’s not the most important thing for an SEO. Increasing organic traffic and improving rankings are common consequences, yes, but the ultimate goal of SEO should always be to legitimately increase your client’s sales.
Beyond all this, let’s not fall into the other extreme that leads us to look only at the revenue generated, as this may cause us to divert our focus on the topics that our content touches and pursue search terms with the highest number of monthly searches despite not being relevant to the niche of the site we are optimizing. Another way to overestimate the ROI objective is, instead of sacrificing keyword relevance, sacrificing keyword quality. Keyword stuffing has been considered a very bad SEO practice for many years. In the world of SEO, like everything else in life, it is important to find a healthy balance that benefits both our clients and the people who browse the Web looking for content that satisfies their search.
What methods do you use to show projected SEO growth in your campaigns? Leave us a comment below and let the thread begin!
As always: Good rankings!