
As SEOs, we make use of a large number of tools on a daily basis to perform our audits and other web optimization tasks. As a result, it is not uncommon for our browser to become overpopulated with plugins, extensions, add-ons, and other add-ons that add additional value to the browser. But what not everyone knows, however, is that there are a lot of things you can do with Google Chrome’s DevTools without having to install additional plugins.
Let’s get started! Remember that to access the DevTools (often misnamed “Google Chrome Inspector”), right-click anywhere on the site and select the “Inspect” option. If you are on Windows, you can use the Ctrl + Shift + I key combination. If you are on Mac, the shortcut is ⌘ + Option + I.
1. How to disable JavaScript on Google Chrome without an extension
When doing a content visibility audit, one of the ways in which we access site content is with JavaScript disabled. This allows us to easily emulate how Google would read certain content. Instead of using a plugin, I followed the steps below:
- Open Google DevTools
- Run a command (Ctrl + P on Windows, ⌘ + Shift + P on Mac)
- Write “Disable JavaScript” and press Enter
To re-enable it, type “Enable JavaScript” and press Enter.
2. How to change user agent without an extension
The user agent is a text string that identifies the web browser and operating system to the web server being accessed. Sometimes an SEO may want to change their user agent to pretend to be Google. The result is that the web page being accessed is displayed to the user as if it were Google. Ideally, you should not show one content to the user and another to Google as this can be considered Cloaking and is punishable. Follow the steps below to modify the user agent with Google Chrome.
- Open Google DevTools
- Run a command (Ctrl + P on Windows, ⌘ + Shift + P on Mac)
- Write “user-agent”
- Select “Show Network conditions” and press Enter
- Unselect the “Select automatically” option, inside the User agent
- Select the user agent you want from the list
- Reload the page
3. How to take a screenshot in Chrome without extensions
In the world of SEO auditors, taking screenshots is an everyday thing. While all operating systems have functionalities that allow screenshots to be taken, they do not allow interaction with the site. This means that if a web page has more content than what is on the screen, the screenshot will not include that content. Not to worry! With Chrome’s DevTools we can get a screenshot of the entire length of the page in a matter of seconds. To make a screenshot of a web page, follow the steps below:
- Open Google DevTools
- Run a command (Ctrl + P on Windows, ⌘ + Shift + P on Mac)
- Write “screenshot”
- Click the option you want:
- Capture area screenshot: Clicking it allows you to draw a rectangle on the site. Everything that enters this box will be recorded as a capture.
- Capture full-size screenshot: Captures the entire screen scroll.
- Capture node screenshot: Captures only the selected node in the elements tab. This is particularly useful when you want to capture a list of items, for example, but without the header, footer, sidebar, etc.
- Capture screenshot: Captures only the content that enters the window.
4. How to search source code with regex (regular expressions)
One way to extract a lot of filtered data from a page is to make use of regular expressions (Regex, for friends). Pressing Ctrl + F inside the Elements tab of the DevTools won’t work, but there is a way to search for Regex patterns in the source code without a plugin. To achieve this, followed the steps below:
- Open Google DevTools
- Run a command (Ctrl + P on Windows, ⌘ + Shift + P on Mac)
- Write “search”
- Select the option “DevTools – Search”
- In the box that opens below, click on the icon. *
- Type the regular expression in the following box
- Press Enter

All the results that match the search pattern you entered will appear below.
5. How to see Chrome headers information without a plugin
Is the page redirected or loaded directly? I am seeing an error…but, what if it is a soft 404? Every day SEOs look at the HTTP Response Code or page load response code. While plugins can give us more information condensed in one place, we can do it directly from the DevTools. If we need to have the client or our technical contact access this information without installing anything on their computer, they can follow the steps below:
- Open Google DevTools
- Go to the “Network” tab and click on the first element. If nothing appears, press Ctrl + R to reload the page.
- Click the first element.
- In the side menu on the right, select the “Headers” tab.

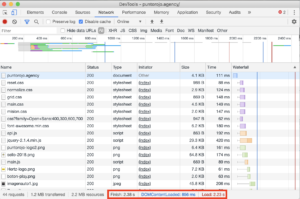
6. How to view page load time in Chrome without an extension
On several occasions, Google reported that page load time is a relevant factor for ranking a web page. Because of this, many SEOs started to prioritize page load time in their strategies. If you want to quickly see how fast a page loads using Google Chrome, follow the steps below:
- Open Google DevTools
- Go to the “Network” tab
- Select “Disable Cache”
- Reload the page without closing the window
- In the DevTools status bar, you will see information written in blue and red. Those are the DOM load times of the page and the whole page, respectively.
- For a more accurate analysis, it is recommended to run this analysis 10 times and report the average values because they tend to vary.
7. How to check the correct installation of the security certificates in Google Chrome without an add-on.
In an attempt to adjust web security, Google started to prioritize sites with encrypted connection certificates in its search results pages. If you are optimizing a site and want to verify the correct installation of certificates, you can do it directly from Google Chrome by following these simple steps:
- Open Google DevTools
- Go to the “Security” tab
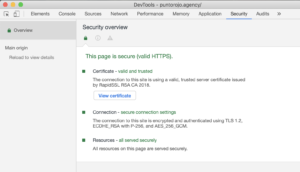
In this tab you can see all the information relevant to the SSL security certificate installed on the site, along with the certificate itself.
8. How to clear the cache on Google Chrome without an extension
When you are constantly entering a page to test or audit it for SEO, it is normal that a certain amount of information starts to be collected on your computer to make your browsing experience as fast as possible. This, however, may be against your interests as an implementation tester. If you want to flush the cache of a page with Chrome, follow the steps below:
- Open Google DevTools
- Go to the “Application” tab
- Click “Clear storage” on the sidebar
- Click on “Clear site data”
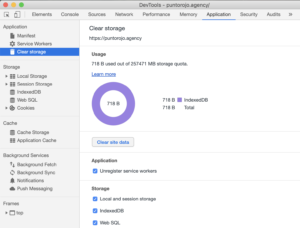
All the local storage should be eliminated. If you want to make sure that all the cache for the page you are navigating is being erased, you can do a hard reload with the combination Ctrl + Shift + R on Windows or ⌘ + Shift + R on Mac.
9. How to simulate the mobile navigation or responsive from Google Chrome
- Open Google DevTools
- Click the second button of the DevTools toolbar
(Ctrl+ Shift + M on Windows or ⌘ + Shift + M on Mac) - When you return to the window with the site, it will be displayed simulating a mobile device.
- Select the type of mobile device from the menu
Bonus tip!
If you want to add a little more style to your mobile device screenshots, you can do the following:
- Open Google DevTools
- Run a command (Ctrl + P on Windows, ⌘ + Shift + P on Mac)
- Write “device frame” and press Enter

The frame of the mobile device containing the screen will now be displayed. This functionality may not be available for all mobile devices.
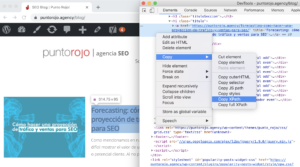
10 . How to find the XPath of an element with Google Chrome
Whether we need to check the content of a specific element on a large number of our own or a competitor’s pages, with XPath we make sure we get exactly the node we need in the DOM of a page. The good news is that with Chrome DevTools it doesn’t matter if you don’t know how to write the specific syntax to get an XPath as you can find it by following the steps below:
- On the page, right-click on the desired element.
- Click on “Inspect”
- In the DevTools window that opens in the “Elements” tab, right-click on the highlighted element.
- Click on “Copy > Copy XPath”
And that’s it! The XPath of that element is in your clipboard.
Bonus tip!
You can use this XPath to extract information from pages using Screaming Frog. To do so, follow the steps below:
- Open Screaming Frog
- Open the menu Configuration > Custom > Extraction
- Select the “XPath” option from the dropdown
- Select what you want to extract from the node (for example, only the text).
- Paste the XPath of the element you want
- Click on OK
Now when you crawl, the text of your XPath node will appear in the “Custom” tab, inside the “Extraction” dropdown.
One more bonus!
11. How to force geolocation in Google Chrome
It is not unexpected that we have to perform redirection audits and/or types of content depending on the location in which the user browsing the site is located. To achieve this, we need to tell Chrome to simulate the navigation pretending that we are in a country, city, or coordination different from the real one. Follow the steps below to change your geolocation with DevTools.
- Open Google DevTools
- Run the command (Ctrl + P on Windows, ⌘ + Shift + P on Mac)
- Write «sensors» and select «Show Sensors»
- Inside the geolocation area, select your location of the dropdown
Conclusion
These tips should improve your daily SEO experience. It’s important to get the most out of each of the tools we have so that we don’t start installing unnecessary plugins that can slow down our web browser.
Do you know any other useful DevTools tips for SEO? Leave us a comment below! As always, good rankings!