
From time to time, some SEO blog posts a list that indicates how likely you are to have someone click on an organic result according to its positioning on Google. These notes usually analyze Google Search Console data from a large number of sites and then average the click-through rate. While this information can be useful, it does not always reflect the reality of our site.
In this post, we are going to see how to make a CTR table according to the positioning of your site. Additionally, we are going to segment those CTR by brand and non-brand results.
Before we start, let’s see why a generic table of CTRs by rank is not always accurate.
- Different SERP layouts: Click-through rates tend to vary for information pages, e-commerce, etc. because the page that Google shows as a search result for a hotel site is not the same as for a news site (for example). A search for hotels is going to show a big map in the SERP and that affects the CTR of the first place, second place, etc.
- Different categories: Beyond the SERP layout, some categories have a more or less tech-savvy audience and the behavior of a 70-year-old user in a SERP is not the same as that of a 13-year-old.
- Different branding weight: The brand term of some companies weighs more than others, for example: if someone searches for “mercadolibre cell phones”, it is clear that he/she is looking to buy through MeLi. However, if someone searches for “Nike sneakers”, they may not necessarily be looking for a result from Nike’s official site.
- Different Title Structures: A page can rank first but not get all the clicks it could get because of an “ugly title structure”. For example, a title with only one word and no branding.
- Title content: Some modifications can be made to a title to get more clicks, for example adding the specific keyword that is being searched, adding a number, a percentage, a yellow keyword, or even adding emojis. The content of the title is also a factor that catches the eye and then the click.
- Presence of an optimized Meta Description: Just like the page title, the Meta Description plays an important role in the SERP CTR. So much so, that Google can display a text (or text summary!) of the page if it considers that it better satisfies the user’s search.
- Etc.
*To see hard metrics about click-through rates in Google SERPs, we recommend this analysis.
I think with these factors it’s clear that we can’t put all sites in the same bag regarding CTR vs. ranking in Google. Let’s see how to get a table with the values 100% related to our site.
- Add Google Search Console data source
The first step is to feed Google Data Studio with the data source that contains all the information about our site. To do this, go to Resource > Manage added data sources. Then click on add a data source.
Next, we add Google Search Console as a source of data:
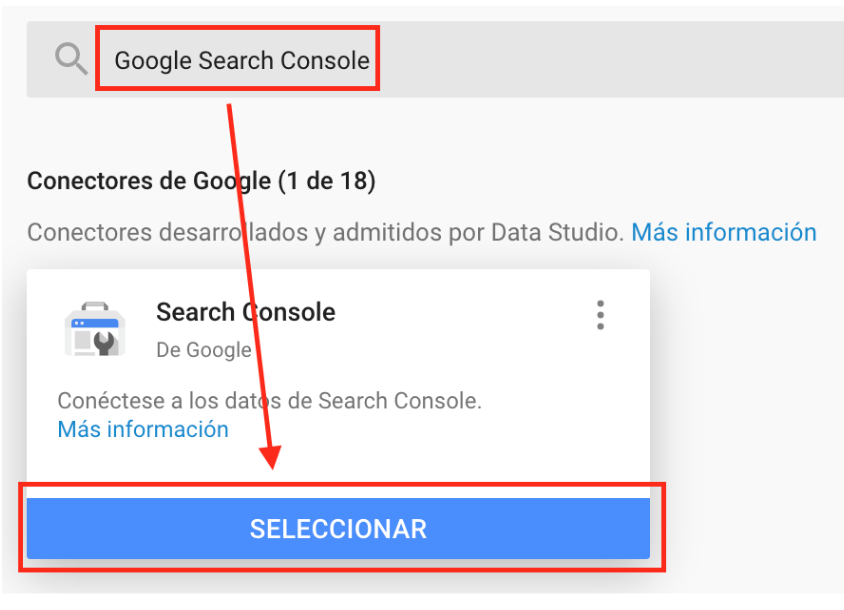
Once the connector is selected, we will choose the site from the list of verified properties we have in the Search Console, then click on Impression of the website and then Connect.
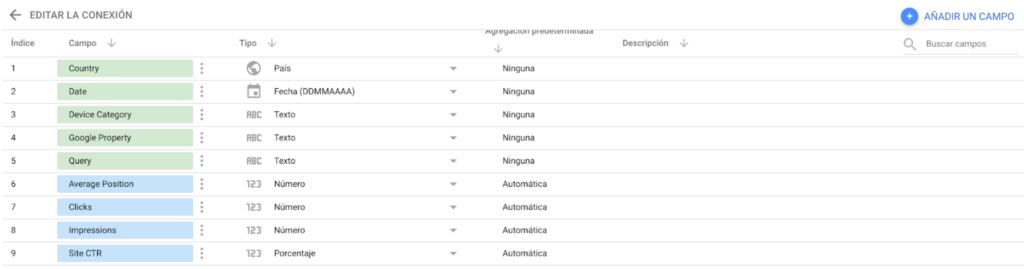
The result should be a list with the default fields for a Search Console property:
- Create a calculated field for brand keywords
Before we start plotting the data, let’s do a little feature engineering. Feature engineering consists of creating new data from existing data.
To make a new calculated field from Data Studio, we have to click on the add a field button.
The name of this field will be Branded, but it can be anything you want, the formula will search inside the Query field (the one with the keyword that brought traffic to the site) and if a regular expression containing the brand name (in this case misitio) is met then it returns “Brand”, otherwise it returns “Non-brand”.
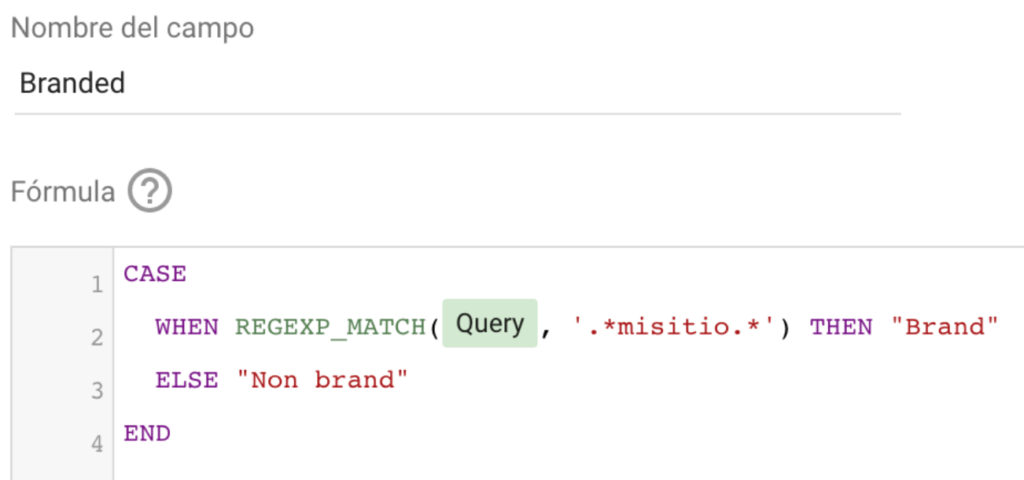
note: instead of ‘misitio’, you have to put the brand name of your site.
- Create a calculated field for truncated average positioning
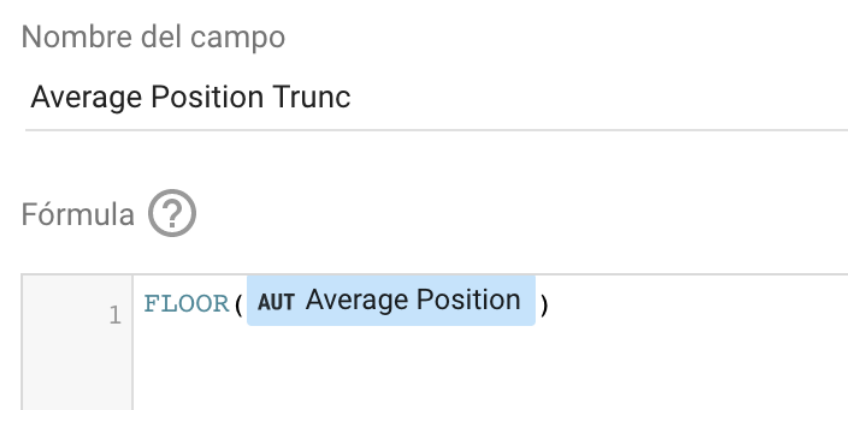
Similar to the previous step, we are going to create a calculated field again, but this time we are going to truncate the average position number. Search Console is the only rank tracker that gives us positioning information with decimals, unfortunately for this report, this information is not useful, so we are going to truncate the values. This means that an average positioning of 1.7 will be considered a first position.
As there is no function to truncate, we are going to round the numbers down with the FLOOR() function, we are going to call this calculated field Average Position Trunc.
Click on save.
- Create a table and complete it with our data
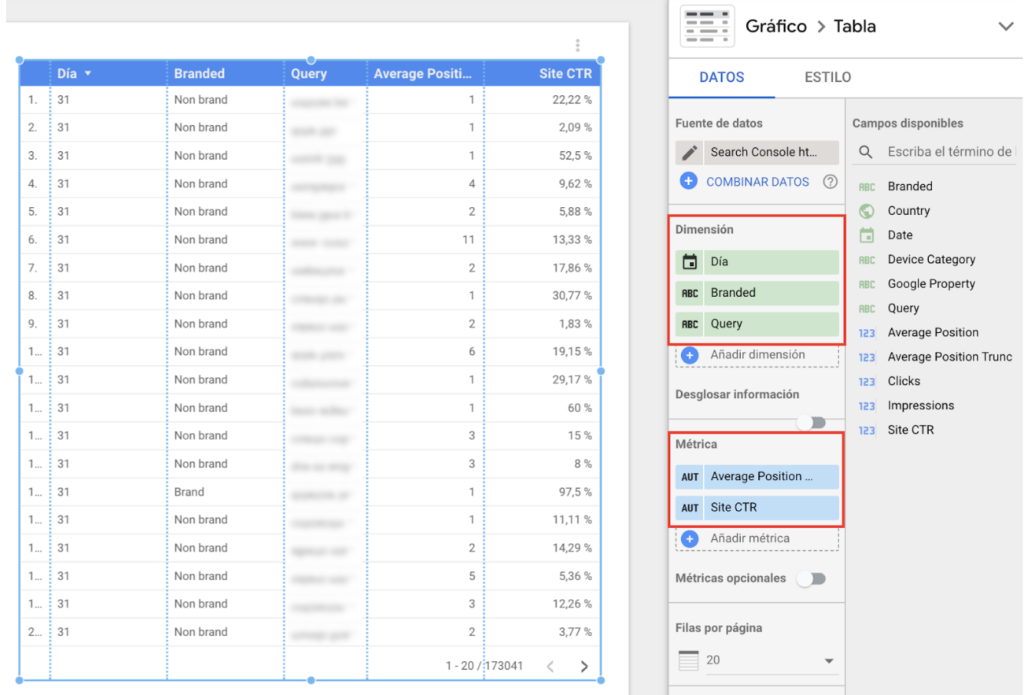
- Configure the table
Once the table is created, we have to configure it to show the data we need. In our case, we break down the data by day and then by Query so that we do not agglomerate the average ranking and average CTR in a single value (the average ranking of the period was X and the average CTR of the period was Y). To break down the data by day, click on the calendar icon next to the date dimension assigned to the chart.
In our case, we will select to view only the data for the last 3 months. This is the period that Google Search Console displays by default when opening the performance report. To configure the period of data that will be displayed, click on Custom, within the Default Period section. Then select This quarter and click on Apply.
![]()
- Export to a CSV
Because Data Studio does not allow us to see the truncated average ranking as a dimension (since it is a number it only shows it as a metric), we cannot filter by ranking. This is why we have to export the table data to Google Sheets to further shape our numbers.
To export the data, click on the large View button at the top right and then on the three dots above the table. Then select the Export to Spreadsheets option.
- Editing data in Google Sheets with a pivot table
Finally, let’s take the average of all the CTRs for each position.
First, we convert the CTR columns to percentage format: click on the Site CTR column and then go to the Format > Number > Percentage menu.
Now let’s create that pivot table!
Go to the menu Data > Pivot Table and then click on Accept
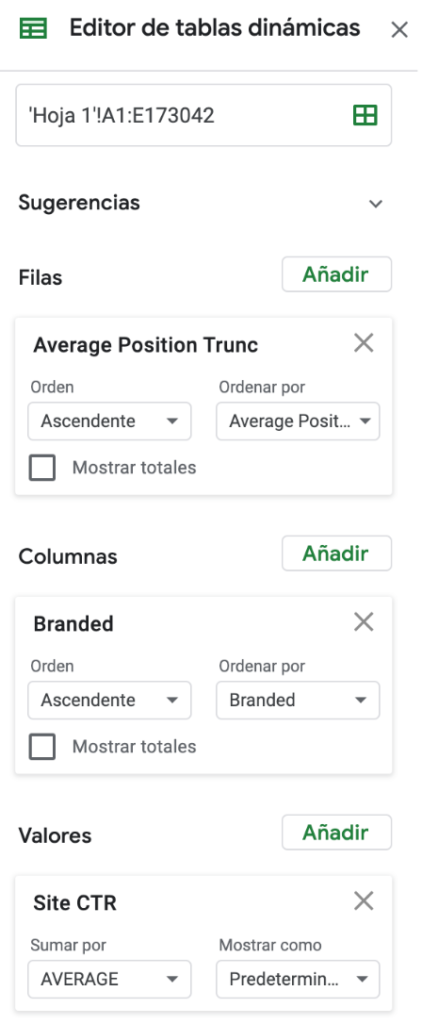
Once we are viewing the pivot table, we have to configure it by clicking on:
- Rows > Add: Average Position Trunc (ascending and without totals)
- Columns > Add: Branded (without totals)
- Values > Add: Site CTR (add by AVERAGE)
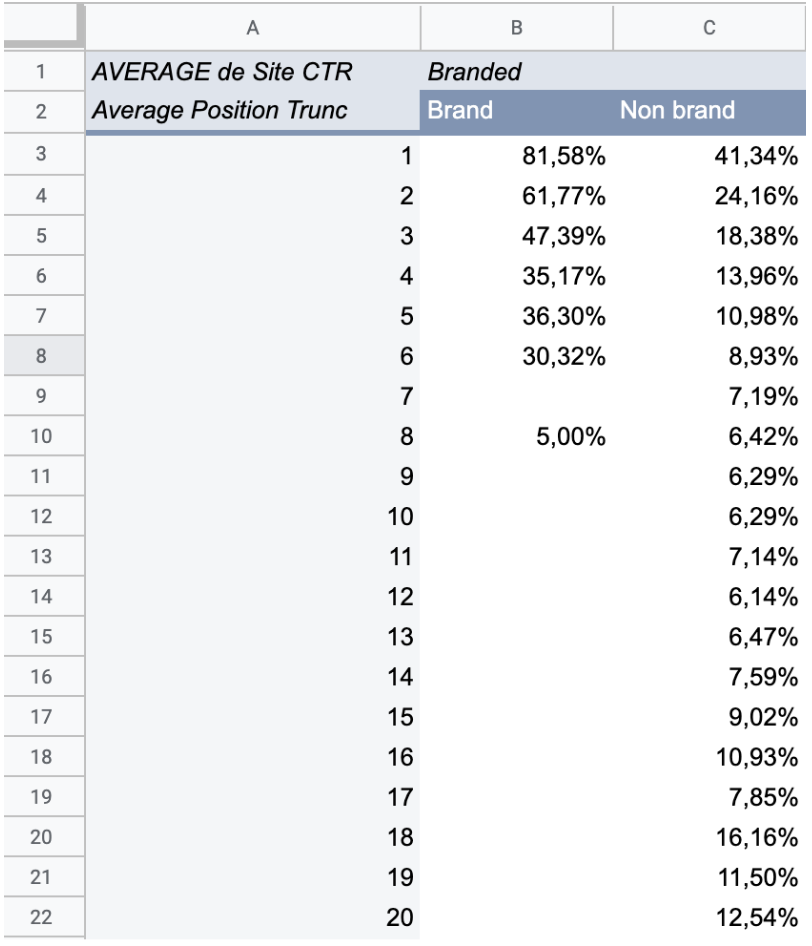
And that’s it! The result should look something like this:
Conclusion
Several insights can be gleaned from this table:
- The rank 1 non-brand for this site is 10% higher than the generic 30 something.
- The site is well-positioned for brand terms as nothing ranks on the 2nd page.
- Brand in rank 1 is twice as high as non-brand for the same rank
- Brand in rank 2 is triple than non-brand for the same rank
- The non-brand CTR of rank 2 + rank 3 is equivalent to a first-rank
- etc.
This table also allows us to make sales projections for SEO. If you haven’t read this post yet, we invite you to take a look at it.
No more using generic CTR tables. Make the table for your site today! We hope this post has helped you. As always, good rankings!